01
The can tells you its weight, live
Pick any can. The platform shows what is inside it in kilograms, updating continuously, with no weighing station and no sampling.
Check it yourselfWeigh it yourself. Bring your own scale.
Proof
What we can put in front of you on a floor, how we would measure it on yours, and what we have not proved yet.
What we will show you
Each of these comes with a way for you to check it yourself on the spot. That is deliberate — a demonstration you cannot verify is just a video.
Pick any can. The platform shows what is inside it in kilograms, updating continuously, with no weighing station and no sampling.
Check it yourselfWeigh it yourself. Bring your own scale.
A feed can approaching empty raises a countdown, and a replacement is staged before the machine stops.
Check it yourselfWatch one through. The alert comes up while the machine is still running.
Take a flagged package and trace it back to the material that produced it, with timestamps at every hop.
Check it yourselfHold a stopwatch. Over a minute and we have overstated it.
A stop is attributed as a machine fault or as recoverable starvation, with the lost kilograms attached.
Check it yourselfCheck a shift of them against your own log.
Everything is on-premise. Tracking, alerting and record-writing continue with no connection to the outside world.
Check it yourselfUnplug it. Thirty seconds.
No new machinery, no change to how the machine runs, no production stop to install.
Check it yourselfWatch one go in. The machines keep running throughout.
From the running system
A drawing cannot be wrong, which is why it cannot be believed. These are cut from the running system: a real can number, a live countdown, your own bay names and count groups.
Cropped, not edited. Each opens at full size.
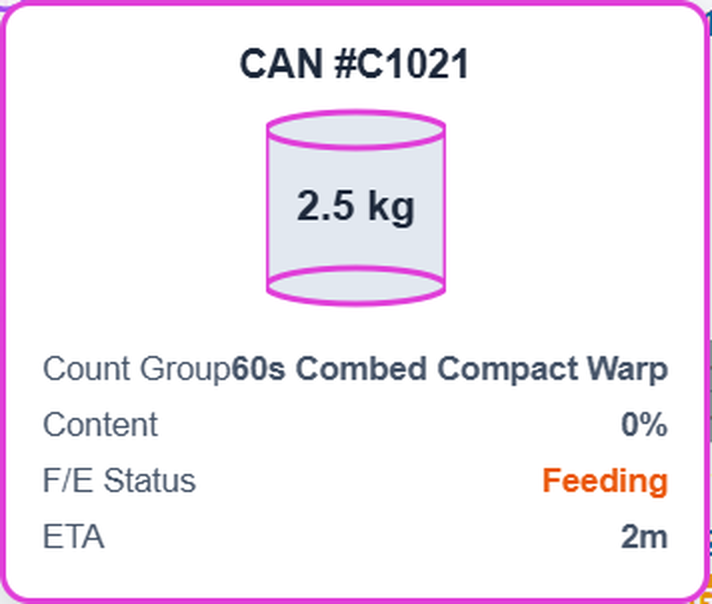
One can, asked what it is
Which can it is, what count group, how much is in it, whether it is filling or feeding. Nobody had to remember any of it.
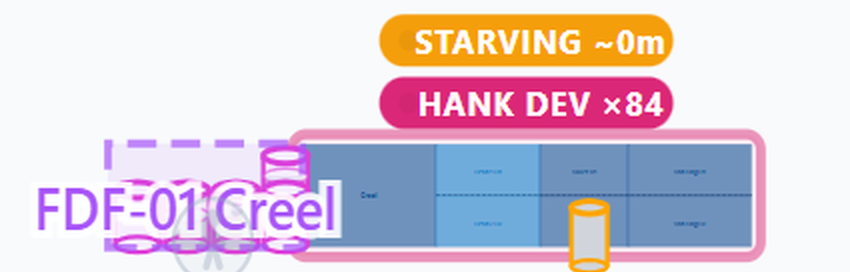
A machine saying it is about to starve
The countdown sits on the machine while it is still running, not in a report written after it stopped.

Live, and it says so
How many cans it is holding, how many are active, how often it refreshes. The number moves while you look at it.
How a trial is measured
Four stages, on your floor, with your people taking the readings. We would rather you distrusted us and measured it properly.
The baseline in stage one is yours to keep regardless of what you decide. Most mills have never had one written down, and it is worth having on its own.
2–4 weeks, before anything is installed
Your floor as it runs today: can movements, stops and their causes, waste weighed per shift. Your people record it, not ours.
You end up withA written baseline you keep, bought or not.
Days, not weeks
One department or one machine group is fitted. Production does not stop.
You end up withA live section running alongside an unchanged one.
A full production cycle, minimum
Both sections measured on the same terms, long enough to survive a bad week and a shift change.
You end up withTwo sets of numbers taken the same way.
One meeting
The two side by side with your team, including where the difference was smaller than we expected.
You end up withA figure for your board, with the method attached.
What we have not proved
You will find out eventually. Better here, where we can also tell you what we are doing about it.
What we have is observation at pilot sites, on floors that were also changing other things at the same time. That is useful and it is not the same as a controlled comparison. A trial run to the protocol above is how that gap gets closed — on your floor, with your numbers.
Figures have circulated internally that our own bench work has not validated, so none of them appear on this site. We will walk you through it on a floor. When we have data we stand behind, it will be published with the method.
It ships to launch customers in shadow mode while it is validated against their real production. We describe it that way everywhere, and we will not present it as a guaranteed capability until the validation says we can.
A fleet has to run for years before mean-time-between-failures means anything. Ours has not run for years. We can tell you what has failed so far and why, which is more useful at this stage than a number with too few data points behind it.
The ROI workbooks carry conservative, moderate and aggressive columns. This site uses conservative and moderate, and never aggressive. If a number here looks unexciting, that is deliberate — it is the one we can defend in a room.
1,000 units built and ready to deploy
87 of them are in service across two mills today. The rest are built and tested — a mill that orders is not waiting on a production run.
No customer is named without written consent, and there is no anonymous logo wall. When a mill agrees to be named, its study appears here with the method attached.
The honest next step
Bring your own scale and your own stopwatch. Two hours on a running floor settles more than any document.
Book a floor visitBefore you come
Six inputs and a payback range on your own floor, with every assumption on screen beside it.
Run your own numbers